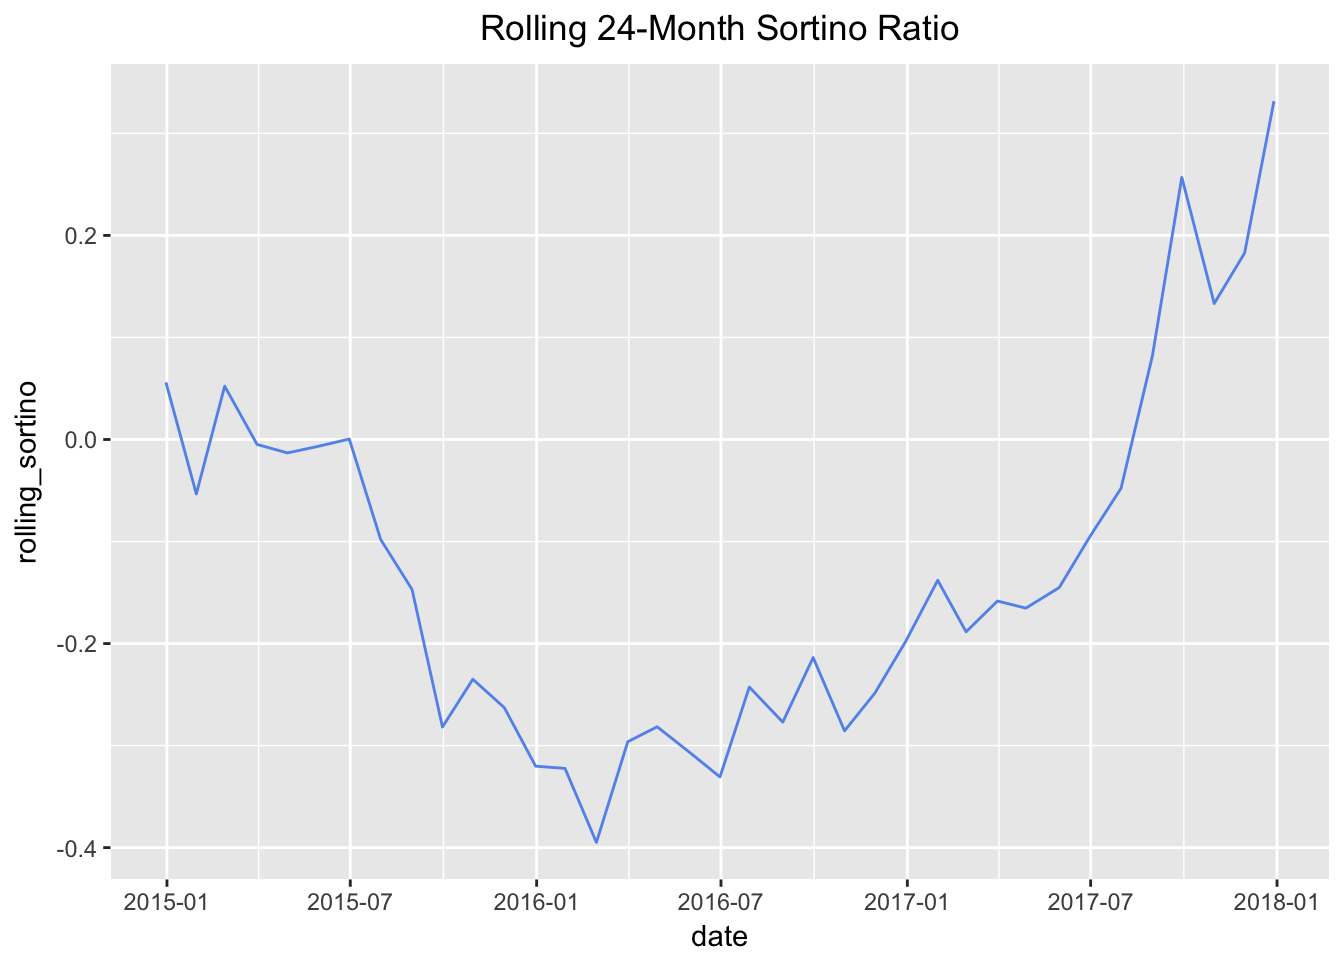
Below is the ggplot visualization of rolling Sortino from Chapter X of Reproducible Finance.
rolling_sortino_xts %>%
  tk_tbl(preserve_index = TRUE, rename_index = "date") %>%
  rename(rolling_sortino = sortino) %>%
  ggplot(aes(x = date, y = rolling_sortino)) +
  geom_line(color = "cornflowerblue") +
  ggtitle("Rolling 24-Month Sortino Ratio") +
  scale_x_date(breaks = pretty_breaks(n = 8)) +
   theme(plot.title = element_text(hjust = 0.5))